NETPILOT LITE Features
📡 Enhanced Ping – View live results with stats and response details.
🧭 Host Discovery – Ping a subnet to find online devices.
🌐 Latency Plotter – Track ping times in real-time graphs.
🧬 Traceroute – Identify delays, loops, or unreachable nodes.
🔢 System Info – Monitor live CPU, RAM, and adapter stats.
🧮 Subnet Calculator – Compute ranges, masks, CIDR, and class info.
📖 NetPilot Academy – Learn networking basics with easy explanations.
System Requirements
NetPilot is a lightweight network utility designed for Windows environments. To ensure optimal performance, your system should meet the following minimum requirements:
🪟 Operating System: Windows 10, 11 (64-bit)
🧠 Memory: 2 GB RAM minimum (4 GB recommended)
💾 Storage: 50 MB free disk space
Enchanced Ping Utility
📡 Take full control of your ping tests with NetPilot’s Enhanced Ping tool
Real-time output with live updates
This utility offers advanced customization and real-time feedback — perfect for troubleshooting specific hosts, validating reachability, or running stress tests. Upgrade to NetPilot Pro to adjust the packet count, size, interval, and timeout to simulate various network conditions and get immediate visibility into latency, and packet loss.
Every result is logged in a clean, readable format so you can analyze behavior, detect spikes, and compare patterns over time — all without leaving the app.
- 📊 Live Statistics:
- Successful vs Dropped
- Average Latency tracking
- Max vs Min Latency tracking
- Overall percentage of successful pings
- 🚦 Status indicators for packet success/failure
- ⚙️ Custom packet size (Pro Feature)
- 🧾 Exportable ping history (Pro feature)
Hosts Discovery Tool
🧭 Quickly identify active devices on your network.
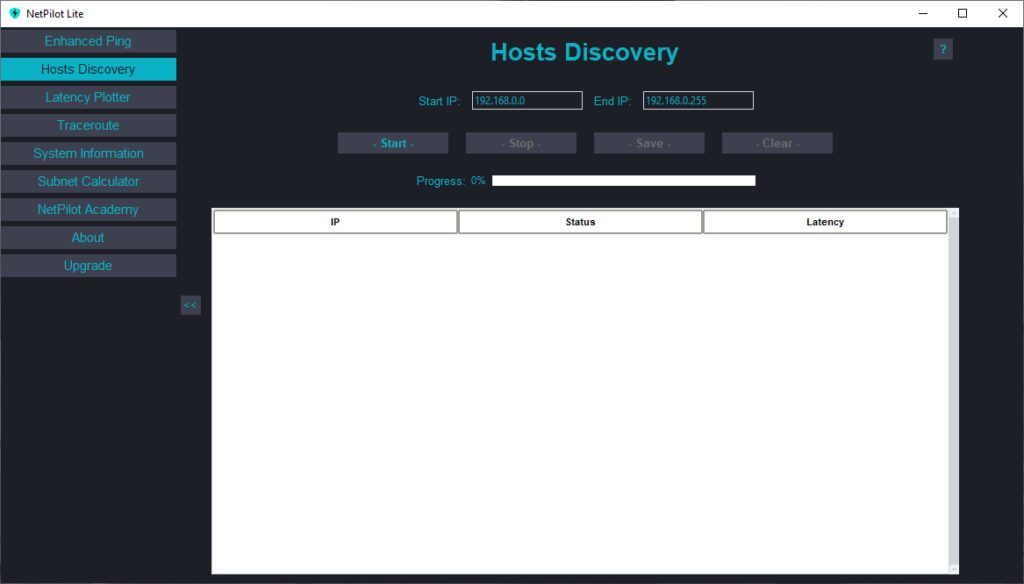
The NetPilot Lite Hosts Discovery tool performs a fast IP scan across a selected range, checking for reachable hosts and measuring their response latency in milliseconds. It’s ideal for mapping out subnet utilization, verifying device status, or prepping for a deeper diagnostic workflow.
Simply enter a start and end IP range, click Start, and let NetPilot handle the rest — returning a real-time list of devices that respond, complete with status and latency metrics.
Once the discovery process is complete sort columns per IP range, activity status, or latency values.
- 🎯 Customizable IP range scanning
- ⚡ Live progress bar and real-time updates
- ✅ Visual differentiation between active and inactive hosts
- 🕒 Displays latency for responsive devices
- 💾 Save & export results for reporting or documentation (Pro Feature)
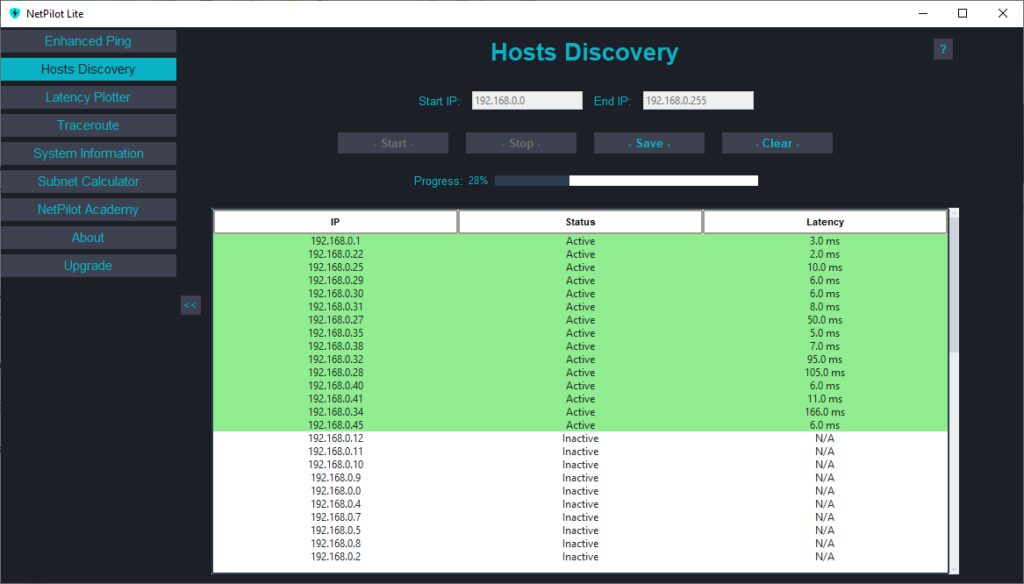
Latency Plotter Page
🎯 Adjustable target IP
Visualize ping response times in real time to identify connection instability.
Get live status information for the following:
- Start time
- Number of pings sent, number successful, and number dropped.
- Average latency over time
- Max Latency over time
- Min Latency over time
- Percentage of successful pings
📈 Visualize Ping Response Times in Real Time
NetPilot Lite’s Latency Plotter gives you instant visual feedback on your network’s performance. Watch ping response times animate in real time to identify active packet loss, and connection instability across any host you choose. Whether you’re troubleshooting a local router or verifying a remote server, this tool brings your network to life with a live graph.
💾 Easly export target performace to a file for reporting (Pro Feature).

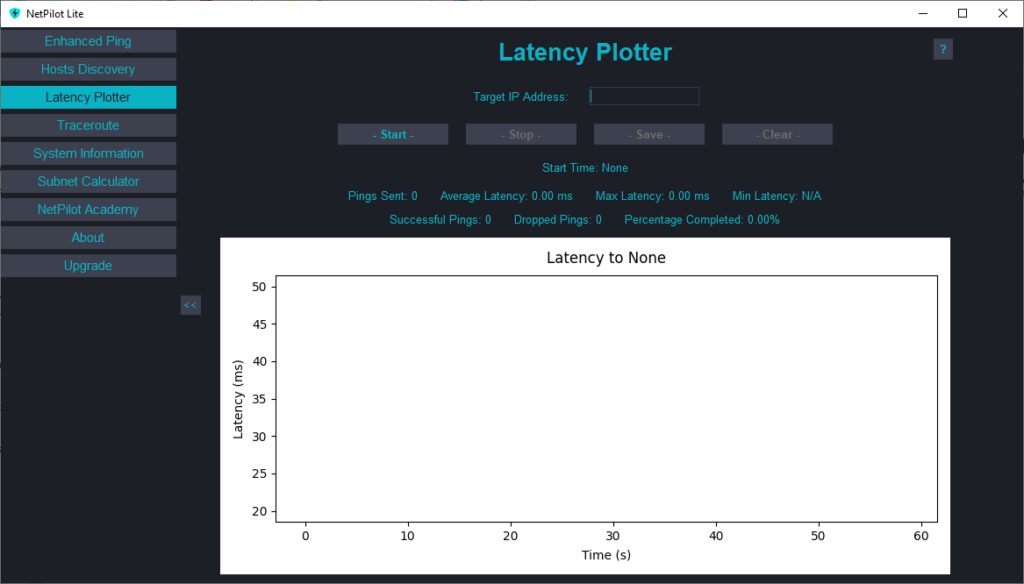
Traceroute Page
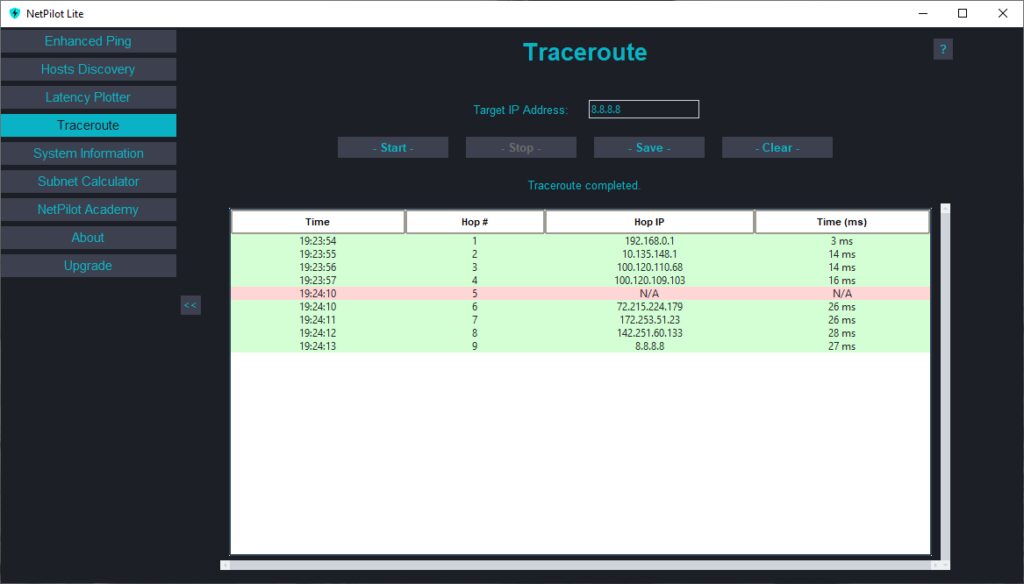
Visualize Every Hop with Traceroute
Quickly map your network’s path, identify bottlenecks, and gain deep insight into each hop between your device and remote endpoints. The Traceroute tool in NetPilot Lite delivers real-time, step-by-step visibility of your packet journey, helping you pinpoint slow links, routing issues, or unreachable nodes—all with a clean, engineer-focused interface. See latency and route changes instantly, making troubleshooting and optimization fast, visual, and intuitive.
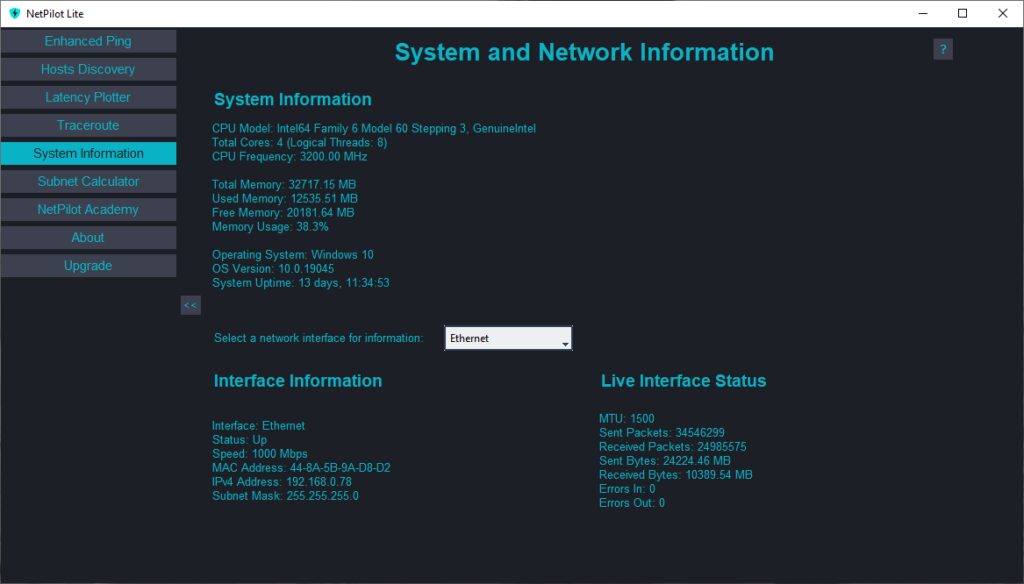
System and Network Information Page
Easy observe live system information
NetPilot Lite’s System Information page provides a comprehensive snapshot of your device’s hardware, operating system, and active network interface. Instantly view critical system stats such as CPU model, memory usage, OS version, and system uptime — all in one place.
Choose from your available network interfaces (Wi-Fi, Ethernet, etc.) to display detailed real-time statistics including interface speed, IP configuration, MAC address, and live packet transmission metrics. Whether you’re validating uptime, tracking packet errors, or verifying IP settings, this dashboard gives you full visibility into your system’s core and connection status.
Subnet Calcuator Page
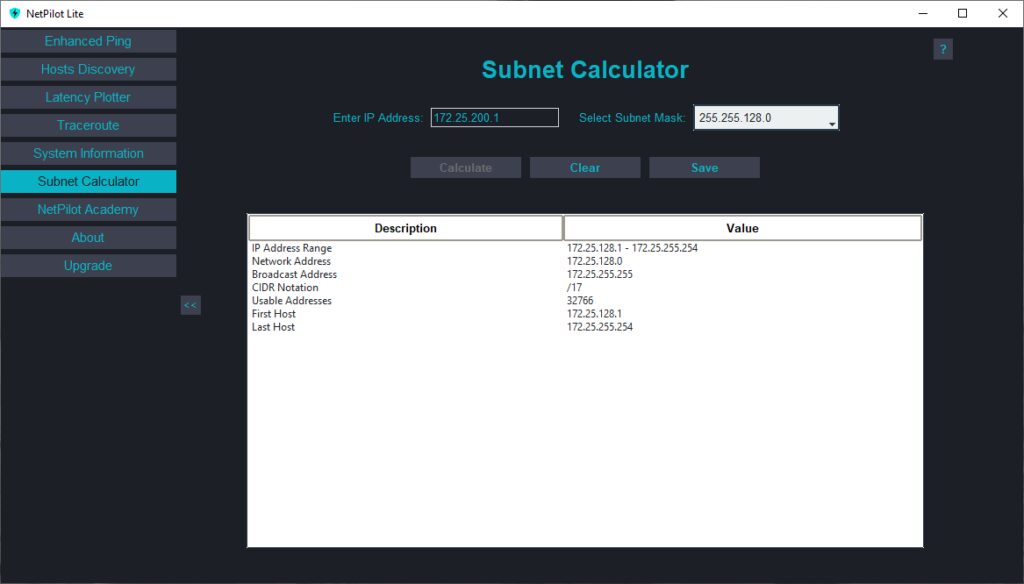
Calculate any Network Subnet Instantly
Take the guesswork out of subnet design with NetPilot Lite’s Subnet Calculator. Instantly generate subnets, visualize address ranges, and optimize your IP allocations—all from a single, streamlined page. Whether you’re planning a new network or managing complex segmentations, our tool gives you the clarity and precision network engineers demand, with live calculations, intuitive input, and detailed breakdowns for every scenario.
NetPiltot Academy Learning Page
📖 Network Engineering Learning Hub
Need to brush up on a protocol or review a tricky network concept? The NetPilot Academy is built right in – giving you instant access to clear, practical summaries of core networking topics. Whether you’re troubleshooting in the field, prepping for certifications, or just want a quick refresher, the Academy makes it simple to stay sharp.
Explore everything from OSI layers and subnetting to security, protocols, and real-world design tips—all just a click away, right inside NetPilot.
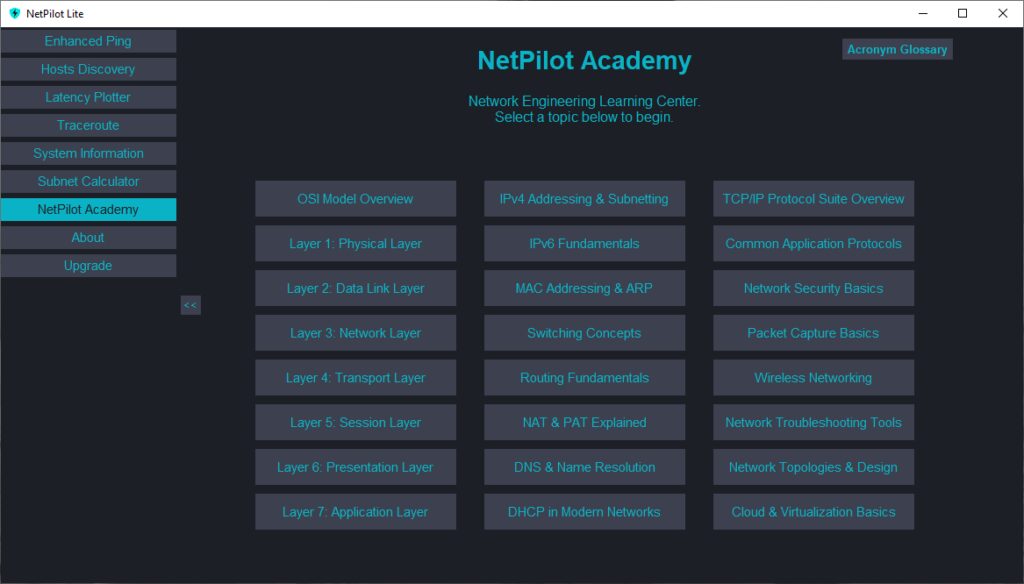
Privacy & Access: No login required, no user data collected, and no internet needed.